The Issue
Shortly after the release of CFWheels 2.0, we started to get reports of slower running requests under certain conditions. For instance, a page which might have had 1000 calls to `linkTo()` could take anything from 1-2ms to 5-6ms a call, which, after 1000 iterations, is one hell of a performance bottle neck. In 1.x, the same call would be between 0-1ms, usually with a total execution time of sub 200ms.
This behaviour was something which could be proven by a developer, but not everyone was seeing the same results: what was the difference? Plugins (or rather, plugins which override or extend a core function, like linkTo()). To make matters worse, the performance degradation was doubled for each plugin, so you might get 1-2ms for 1 plugin, 2-4 ms for adding another plugin and so on.
So what was causing this?
Enter FusionReactor
We approached FusionReactor, who were kind enough to give us a temporary licence to help debug the issue (it’s great when companies support open-source!). So next up were some tests to help diagnose the issue.
Installing FusionReactor was really simple. As we use CommandBox locally, we could just utilise the existing module via install commandbox-fusionreactor to bootstrap FusionReactor onto our local running servers, which gave us access to the FR instance, already plumbed in. As we were looking for a specific line of code, we also installed the FusionReactor Lucee Plugin and configured it track CFML line execution times using the CF line performance explorer.
This was instantly illuminating, and tracked the problem to our new pluginrunner() method. When we released CFWheels 2.0, there was a fairly heft rewrite of the plugins system. It was designed to be able to allow for plugins to be chained, and execute in a specific order, so you could hypothetically have the result from one plugin overriding the previous one in the chain.
The way it did this was by creating a “stack” of plugins in an array, working out where it was in that stack, and executing the next plugin in the stack till it reached the end. It did that via a combination of callStackGet() and getFunctionCalledName() function to do the comparison.
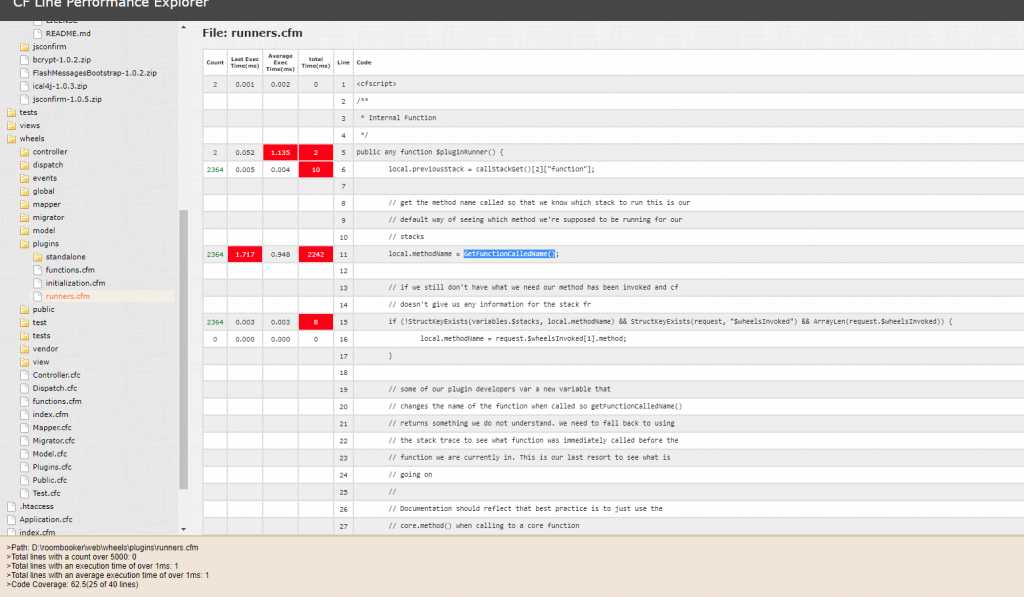
As you can see from the screenshot below, the line debugger clearly highlights this. This app had four plugins, two of which extended core functions.

callStackGet() gets invoked 2364 times in this example, but appeared performant, only causing 10ms execution time. getFunctionCalledName() is called the same number of times, but has a total execution time of 2242ms(!). We had our potential culprit. Either way, it was looking like the combination of calling the stack and trying to find the calling function name which was causing so much pain. I suspect it’s to do with how Java deals with this: I think it might be calling a full stack trace and writing it to disk on each call – at least that was the hint from FusionReactor’s thread profiler (I’m sure those who have a better understanding of Java’s underlying functions will chip in).
After some deliberation, we decided to revert this behaviour in CFWheels 2.1 back to how it used to work in 1.x, as the vast majority weren’t using it, but were being affected by it. We’d seen no plugins in the wild which used this behaviour either, which was largely undocumented.
Obviously thanks to FusionReactor for helping us out – hopefully this gives some insight into just one of the ways FusionReactor can be used. Maybe one day I’ll understand Java stack traces – maybe.
